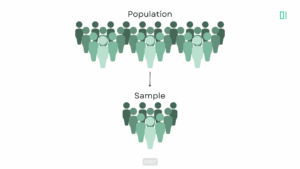
Data is the backbone of statistics. In today’s data-driven world, whether in business, research, or everyday decision-making, understanding different Types of Data in Statistics helps us analyze and interpret information effectively. Understanding data types in statistics is crucial because it guides us in choosing the right methods for analysis. By categorizing data effectively, we can make informed decisions and ensure accurate results.
Types of Data in Statistics
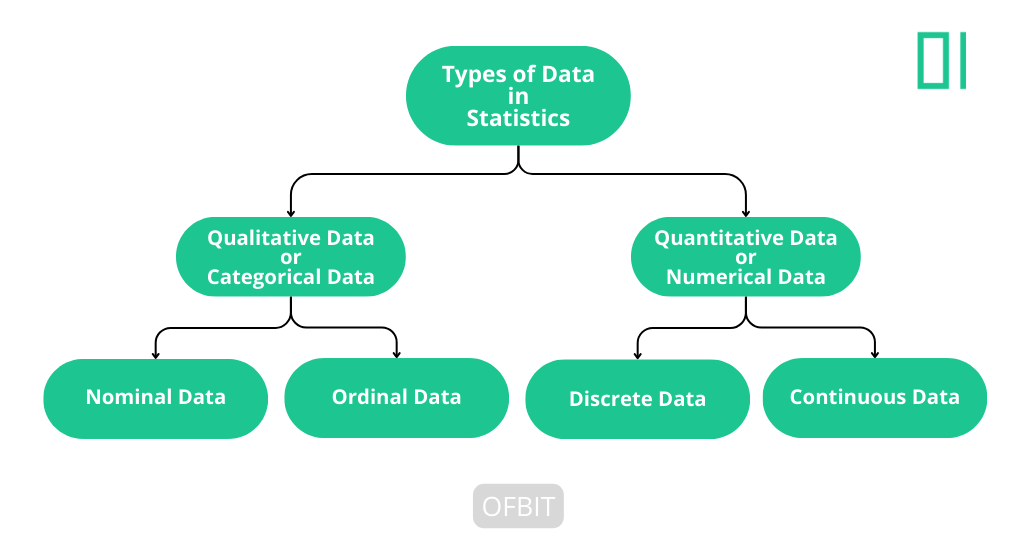
There are two distinct types of data in statistics that can be used in statistical analysis.
- Qualitative Data or Categorical Data
- Quantitative data or Numerical Data.
Further, Categorical or Qualitative Data can have two distinct measurement scales: Nominal Data and Ordinal Data. Qualitative Data can also have two basic types: Discrete Data and Continuous Data.
The next sections will explain each different type of data in statistics with examples.
Qualitative Data or Categorical Data
Qualitative data, also known as Categorical Data, is used to define the Category of the Data. Describes qualities or characteristics and is not measured in numbers. Instead, it is classified into categories. This type of data helps in identifying patterns and trends but cannot be used for numerical calculations.
Examples of categorical data include a person’s occupation (Business, Salaried, Freelancer), marital status (Single, Married, Divorced), eye color (Brown, Blue, Green), and payment method (Cash, Credit Card, UPI).
Type of Qualitative Data or Categorical Data
The Categorical Data can be of two distinct measurement scales called Nominal Data and Ordinal Data.
Nominal Data
Nominal data is a type of qualitative information that consists of categories or names used to label variables without assigning numerical values. This data cannot be ordered or ranked in any meaningful way.
Since there is no ranking in nominal data, you cannot say one category is greater or lesser than another. It is typically analyzed using mode (the most frequent category) and represented through bar charts or pie charts.
Businesses use nominal data to segment customers based on preferences, demographics, or behavior.
Examples of Nominal Data
Examples of Nominal Data include gender (male/female), eye color (blue/brown/green), or car brands (Toyota, Ford, BMW).
Ordinal Data
Ordinal Data represents categories with a meaningful order or rank but without fixed intervals between values.
In ordinal data, you can compare values by saying one is “higher” or “better” than another, but you cannot measure the exact difference between them. For instance, the gap between “Fair” and “Good” may not be the same as between “Good” and “Excellent.”
Ordinal data is commonly analyzed using the median (the middle value in an ordered list) and visualized with bar charts or frequency tables.
Businesses use ordinal data to measure customer feedback, employee performance, and product reviews.
Examples of Ordinal Data
Examples of ordinal data include:
- Customer satisfaction ratings (e.g., Very Satisfied, Satisfied, Neutral, Dissatisfied, Very Dissatisfied)
- Education levels (e.g., High School, Bachelor’s, Master’s, Ph.D.)
- Movie ratings (e.g., 1 star, 2 stars, 3 stars, 4 stars, 5 stars)
- Economic status (e.g., Low, Middle, High)
Quantitative data or Numerical Data
Quantitative Data refers to data that can be measured, counted, or expressed in numerical values, thus it is also called Numerical Data. It answers questions like ‘How much?’, ‘How many?’, or ‘How often?’ and is used for statistical analysis, mathematical calculations, and comparisons.
It helps researchers, businesses, and analysts make data-driven decisions by identifying patterns, trends, and relationships.
Numerical data includes measurable values such as height, weight, length, temperature, age, and the number of students in a class.
Types of Quantitative Data
Qualitative data is also of two basic types Discrete Data and Continuous Data.
Discrete Data
In statistics, discrete data consists of countable, distinct, and separate values which cannot be divided into smaller parts. These values are always whole numbers, such as the number of students in a class, cars in a parking lot, or books on a shelf.
Discrete data is finite and structured, making it useful for classification and analysis. It plays a key role in business, healthcare, education, and transportation, where organizations track numbers like products sold, patients admitted, or vehicles passing a toll gate.
Since discrete data provides clear insights, it is essential for decision-making and statistical analysis across various industries.
Example of Discrete Data
Examples of discrete data include:
- The number of students in a classroom (e.g., 30 students).
- The number of cars in a parking lot (e.g., 50 cars).
- The number of books on a shelf (e.g., 120 books).
- The number of heads in 100 coin flips (e.g., 45 heads).
Since discrete data consists of whole numbers, you cannot have 3.5 students in a class or 2.8 books on a shelf.
Continuous Data
Continuous Data represents measurable values that can take any number within a given range.
For example, height, weight, temperature, and salary ranges are all forms of continuous data. A person’s height can be 5.7 feet or 5.75 feet, and the temperature can be 25.3°C or 25.35°C, showing that values vary smoothly without gaps.
Since continuous data can be measured rather than counted, it plays a vital role in fields like science, healthcare, finance, and engineering. Businesses use it to analyze trends, track performance, and make data-driven decisions.
Understanding continuous data helps in making accurate predictions and better insights.
Example of Continuous Data
Examples of continuous data include:
- A person’s height (e.g., 5.7 ft, 5.85 ft).
- A baby’s weight at birth (e.g., 3.7 kg, 3.85 kg).
- Temperature readings (e.g., 24.5°C, 22.55°C).
- Speed of a car (e.g., 65.4 mph, 80.45 mph).
Types of Data in Statistics – Summary
In this tutorial, you have learned the types of data in statistics. The two main categories are Categorical (Qualitative) Data and Quantitative (Numerical) Data, which are further classified into Nominal Data, Ordinal Data, Discrete Data, and Continuous Data. You also learned about each type with relevant examples.
Understanding the types of data in statistics is essential for accurate data analysis and informed decision-making. Whether you’re a student, researcher, or business professional, knowing how to classify and interpret data will help you make better, data-driven decisions.
Stay Connected & Keep Learning!
Did you find our articles and tutorials helpful? Stay updated with more expert tips—Follow us on Facebook and Instagram!
Be Part of a Global Tech Network! Join our Official Facebook Group for live Q&A, discussions, and networking with a global tech community!